The ancestral (streptomycin sensitive) and evolved (streptomycin resistant) forms of HAMBI_1287 and HAMBI_1977 were combined in 1:1 ratio in wells on a 96 deep-well plate and grown in batch serial transfer protocol. Every 48 hours, 10 μl of culture was transfered to 500 μl of 100% fresh R2A broth (50 fold dilution) at four different streptomycin levels: 0, 16, 64, and 256 μg/ml. Plates were incubated in the dark at 30C with shaking at 800 RPM for a total of eight growth cycles (16 days). For every growth cycle \(\mathrm{log_2(50)} \approx 5.6\) generations will have elapsed for a total of about 45 generations over eight cycles.
Note we are using the Colony Forming Unit estimators provided in the paper:
Martini KM, Boddu SS, Nemenman I, Vega NM. 2024. Maximum likelihood estimators for colony-forming units. Microbiol Spectr 12:e03946-23. https://doi.org/10.1128/spectrum.03946-23
Show/hide code
##### Librarieslibrary(here)library(tidyverse)library(errors)source(here::here("R", "utils_cfus.R"))##### Global variablesdata_raw <- here::here("_data_raw", "longterm_coculture")data <- here::here("data", "longterm_coculture")##### make processed data directory if it doesn't existfs::dir_create(data)
Rows: 82 Columns: 7
── Column specification ────────────────────────────────────────────────────────
Delimiter: "\t"
chr (3): strain, plate, well
dbl (4): count, dilution, strep, rep

ℹ Use `spec()` to retrieve the full column specification for this data.
ℹ Specify the column types or set `show_col_types = FALSE` to quiet this message.
Show/hide code
# Global vars -------------------------------------------------------------# set the poisson threshold N. This should be a value over which you don't trust the counts# for the 2.5 ul spotting assay a good value for this is 50N <-100# set the MLE threshold NMLE. A good starting estimate is the ratio of the total area of # the plate/spot to the average colony size. Used for calculating MPN. For a 100 mm petri # dish a good value is 5000. For a 2 ul spot, a decent value is 100NMLE <-100# the output will be expressed in terms of absolute CFU in the amount that was plated or # spotted. It is very important that the same spotting/plating volume be used for# all dilutions. To convert to CFU/ml divide R by the spot/plating volume. E.g., if these# are counts from the 96-well spot assay the value is usually 0.002 or 0.0025sampling_vol <-0.0025
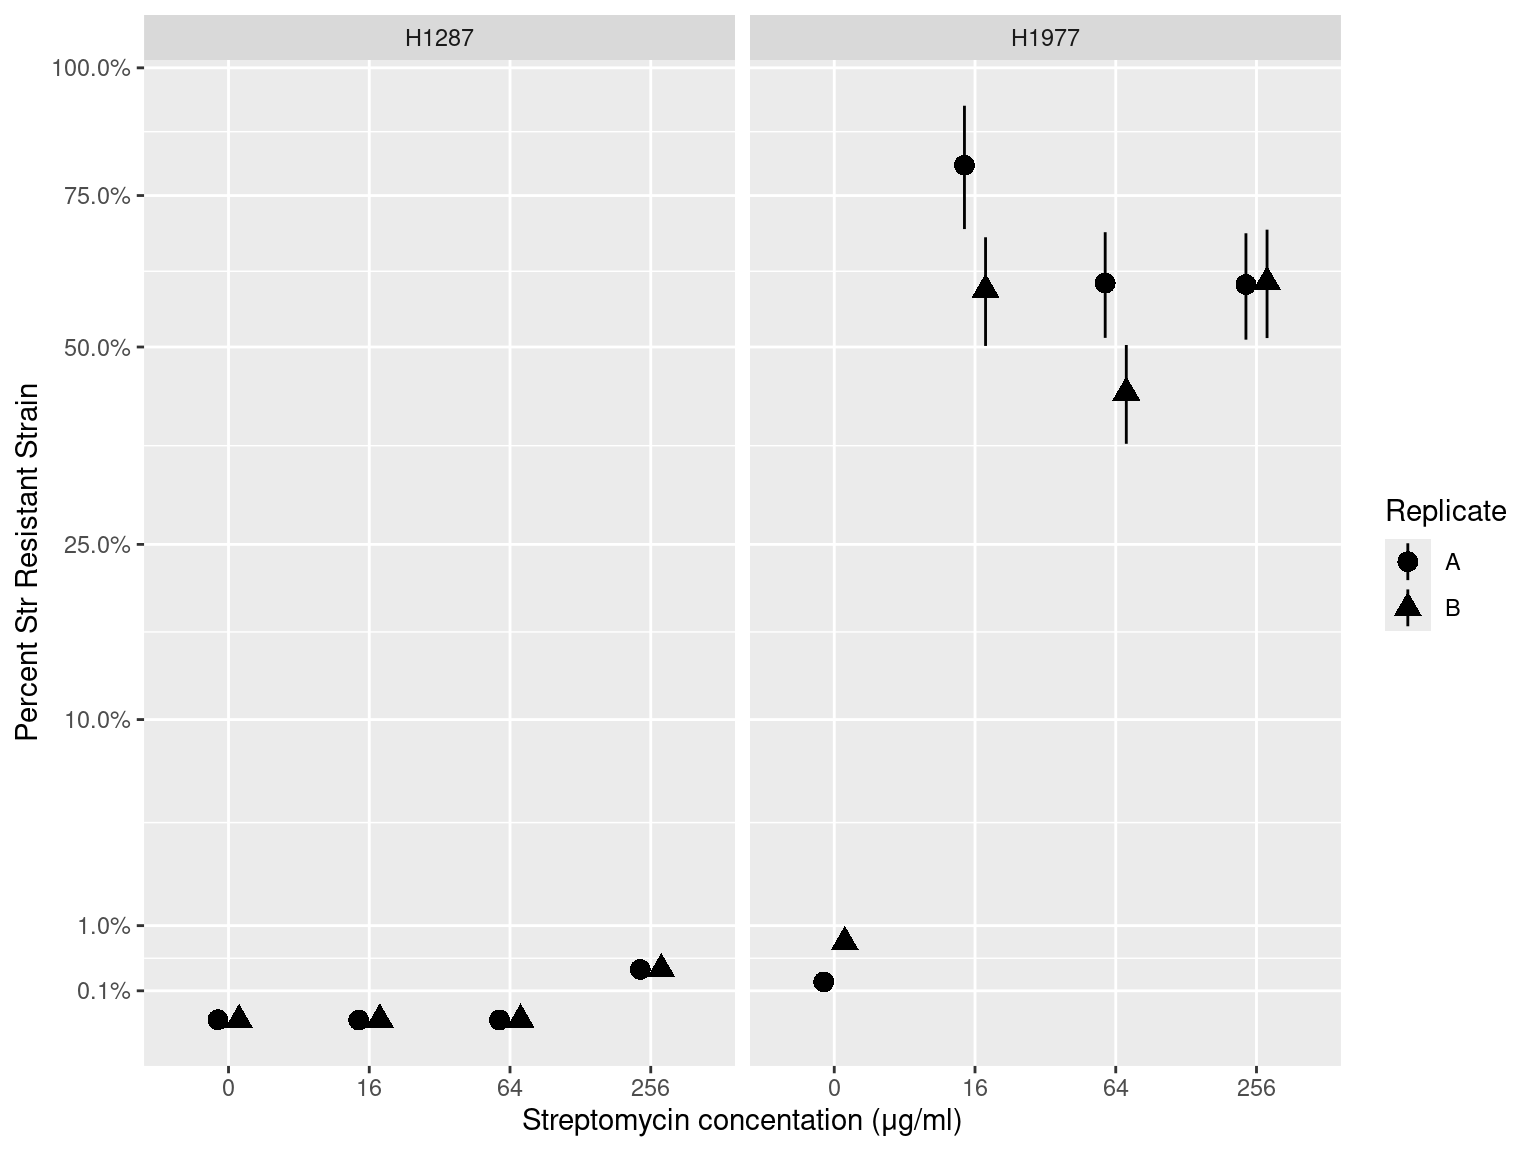
Figure 1: Results of long-term competition experiments between the Streptomycin Sensitive and Resistance forms of each species: H1287 = Citrobacter koseri 1287 and H1977 = Pseudomonas chlororaphis 1977. Vertical axis depicts the percentage of the Streptomycin resistant form after eight 48 hour transfers. Horizontal axis depicts the four streptomycin concentrations tests. Shape depicts the experimental replicate. Error bars are errors from the ML estimator and standard propagation of error.
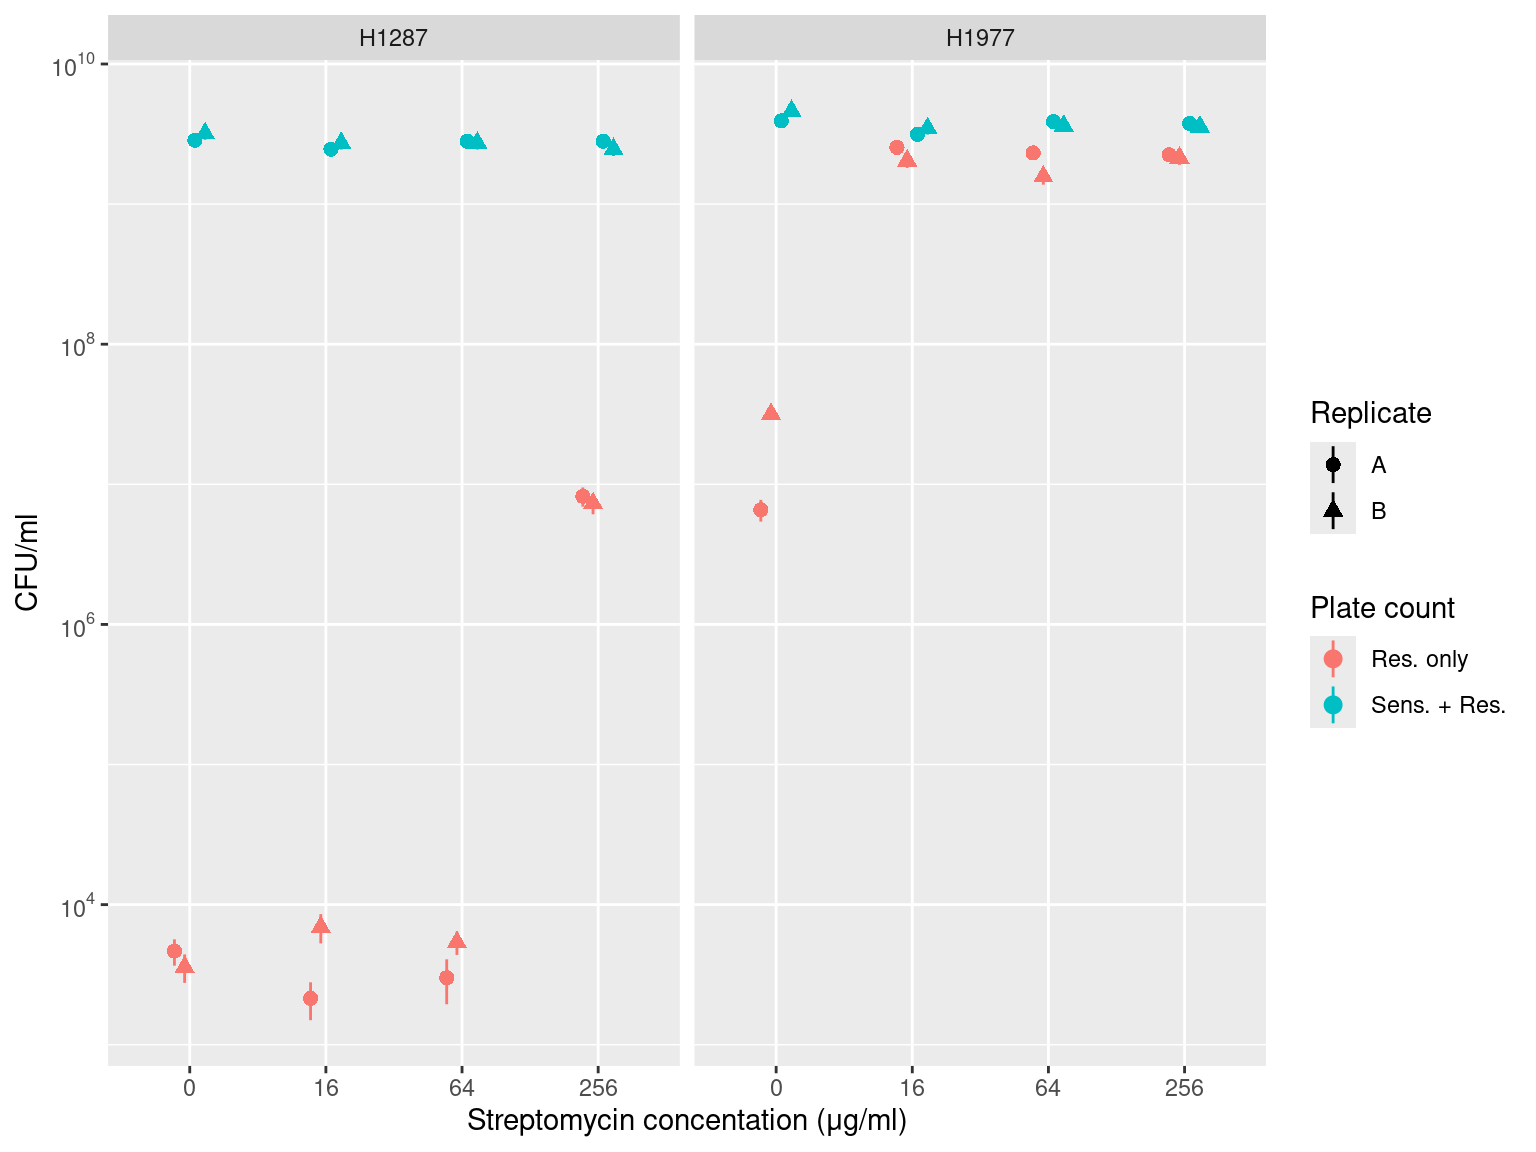
Figure 2: Results of long-term competition experiments between the Streptomycin Sensitive and Resistance forms of each species: H1287 = Citrobacter koseri 1287 and H1977 = Pseudomonas chlororaphis 1977. Vertical axis depicts the absolute number of Colony Forming Units (CFU) per ml of culture after eight 48 hour transfers. Horizontal axis depicts the four streptomycin concentrations tests. Point color depicts whether counts were made on an agar plate allowing growth of both the sensitive and resistant forms (blue, ‘Sens. + Res.’) or the resistant form only (red, 5000 ug/ml streptomycin, ‘Res. Only’). Shape depicts the experimental replicate. Error bars are errors from the ML estimator.
Source Code
---title: "CFUs long-term competition experiment"author: "Shane Hogle"date: todaylink-citations: trueabstract: "Competition outcomes in long(er)-term experiments"---# IntroductionThe ancestral (streptomycin sensitive) and evolved (streptomycin resistant) forms of HAMBI_1287 and HAMBI_1977 were combined in 1:1 ratio in wells on a 96 deep-well plate and grown in batch serial transfer protocol. Every 48 hours, 10 μl of culture was transfered to 500 μl of 100% fresh R2A broth (50 fold dilution) at four different streptomycin levels: 0, 16, 64, and 256 μg/ml. Plates were incubated in the dark at 30C with shaking at 800 RPM for a total of eight growth cycles (16 days). For every growth cycle $\mathrm{log_2(50)} \approx 5.6$ generations will have elapsed for a total of about 45 generations over eight cycles.Note we are using the Colony Forming Unit estimators provided in [the paper:](https://doi.org/10.1128/spectrum.03946-23)> Martini KM, Boddu SS, Nemenman I, Vega NM. 2024. Maximum likelihood estimators for colony-forming units. Microbiol Spectr 12:e03946-23.https://doi.org/10.1128/spectrum.03946-23```{r}#| output: false##### Librarieslibrary(here)library(tidyverse)library(errors)source(here::here("R", "utils_cfus.R"))##### Global variablesdata_raw <- here::here("_data_raw", "longterm_coculture")data <- here::here("data", "longterm_coculture")##### make processed data directory if it doesn't existfs::dir_create(data)``````{r}cfus_5050 <-read_tsv(here::here(data_raw, "20250911_cfu_5050_start.tsv"))``````{r}# Global vars -------------------------------------------------------------# set the poisson threshold N. This should be a value over which you don't trust the counts# for the 2.5 ul spotting assay a good value for this is 50N <-100# set the MLE threshold NMLE. A good starting estimate is the ratio of the total area of # the plate/spot to the average colony size. Used for calculating MPN. For a 100 mm petri # dish a good value is 5000. For a 2 ul spot, a decent value is 100NMLE <-100# the output will be expressed in terms of absolute CFU in the amount that was plated or # spotted. It is very important that the same spotting/plating volume be used for# all dilutions. To convert to CFU/ml divide R by the spot/plating volume. E.g., if these# are counts from the 96-well spot assay the value is usually 0.002 or 0.0025sampling_vol <-0.0025``````{r}cfus_ml_5050_estimates <- cfus_5050 %>%filter(count >0 ) %>%nest(.by =c(strain, plate, strep, rep)) %>%mutate(r =map(data, \(x) find_estimators(x$count, x$dilution, N=N, NMLE=NMLE))) %>%unnest(r) %>%mutate(CFU_ml = r/sampling_vol, CFU_ml_stderr = stderr/sampling_vol) %>%mutate(count_type =if_else(plate =="0_str", "Sens. + Res.", "Res. only"),replicate = LETTERS[rep])cfus_ml_5050_estimates_ratio <- cfus_ml_5050_estimates %>%mutate(y = errors::set_errors(CFU_ml, CFU_ml_stderr)) %>%summarize(f_evo = y[plate =="5000_str"]/y[plate =="0_str"],.by =c(strain, strep, replicate, type)) %>%mutate(f_evo_e = errors::errors(f_evo)) %>%mutate(f_evo = errors::drop_errors(f_evo))```::: {#fig-01}```{r}cfus_ml_5050_estimates_ratio %>%filter(type =="ML_estimator") %>%ggplot(aes(x =factor(strep), y = f_evo, shape = replicate)) +geom_pointrange(aes(ymin = f_evo - f_evo_e, ymax = f_evo + f_evo_e), size =0.75,position =position_dodge(width =0.3)) +facet_grid(~strain) +labs(y ="Percent Str Resistant Strain", x ="Streptomycin concentation (μg/ml)", shape ="Replicate") +scale_y_sqrt(labels = scales::percent, breaks =c(1, 0.75, 0.5, 0.25, 0.1, 0.01, 0.001))```Results of long-term competition experiments between the Streptomycin Sensitive and Resistance forms of each species: H1287 = *Citrobacter koseri* 1287 and H1977 = *Pseudomonas chlororaphis* 1977. Vertical axis depicts the percentage of the Streptomycin resistant form after eight 48 hour transfers. Horizontal axis depicts the four streptomycin concentrations tests. Shape depicts the experimental replicate. Error bars are errors from the ML estimator and standard propagation of error.:::::: {#fig-03}```{r}cfus_ml_5050_estimates %>%filter(type =="ML_estimator") %>%ggplot(aes(x =factor(strep), y = CFU_ml, color = count_type, shape = replicate)) +geom_pointrange(aes(ymin = CFU_ml - CFU_ml_stderr, ymax = CFU_ml + CFU_ml_stderr), size =0.5,position =position_dodge(width =0.3)) +facet_grid(~strain) +labs(y ="CFU/ml", x ="Streptomycin concentation (μg/ml)", shape ="Replicate", color ="Plate count") +scale_y_log10(labels = scales::label_log())```Results of long-term competition experiments between the Streptomycin Sensitive and Resistance forms of each species: H1287 = *Citrobacter koseri* 1287 and H1977 = *Pseudomonas chlororaphis* 1977. Vertical axis depicts the absolute number of Colony Forming Units (CFU) per ml of culture after eight 48 hour transfers. Horizontal axis depicts the four streptomycin concentrations tests. Point color depicts whether counts were made on an agar plate allowing growth of both the sensitive and resistant forms (blue, 'Sens. + Res.') or the resistant form only (red, 5000 ug/ml streptomycin, 'Res. Only'). Shape depicts the experimental replicate. Error bars are errors from the ML estimator.:::